Once a product sells out on Shopify, most merchants lose the one thing they need most to make a smart reorder decision: real demand data. Historical sales velocity tells you how fast an item moved while it was in stock, but the moment it's gone, that number stops updating. Whether ongoing demand for a sold-out variant is still strong, or has actually cooled off, sales history alone can't tell you. Tracking demand for out-of-stock products is really about finding a data source that keeps working after the product page shows Sold Out, and using it to decide what to reorder first.
Why Sales Velocity Goes Blind the Moment a Product Sells Out
Sales velocity, units sold per day or week, is a useful rear-view metric. It reflects demand that already existed while the item was available to buy. Once a variant sells out, that number freezes in place. A product that was selling briskly right up until it ran out could still have a wave of unmet demand behind it: shoppers landing on the page every day, seeing Sold Out, and leaving without a way to act on their interest. Or demand could have already cooled, and the remaining interest is minimal.
From the sales report alone, both scenarios look identical: zero units sold. Reordering based on the last known velocity, without checking what's happening on the product page today, means guessing in the dark for exactly the products where getting it right matters most.
Back-in-Stock Subscriber Counts Are a First-Party Demand Signal
This is where shopify back in stock analytics fill the gap. A back-in-stock widget (see our guide to adding a Notify Me button if yours isn't set up yet) lets shoppers who land on a sold-out product page leave their email to be notified the moment it's back. Every one of those signups is a shopper actively telling you, after the item was already gone, that they still want it. That's a live signal generated by real visitors on the actual product page, not an estimate pulled from a spreadsheet.
Because the signups happen at the variant level rather than just the product level, you can also see which specific size, color, or SKU is driving the interest. A shirt that sold out in one color might show a stack of subscribers on that color and almost none on another, telling you exactly which variant to prioritize when you reorder, instead of restocking the whole style evenly.
Turning Subscriber Counts Into a Reorder Decision
Collecting subscriber counts only helps if you can actually see them somewhere useful. Griffin's Subscriber Analytics dashboard is built around exactly this: it shows which products have the most demand waiting, so merchants can use real data to prioritize restocking decisions instead of relying on gut feel or how a product performed months ago.
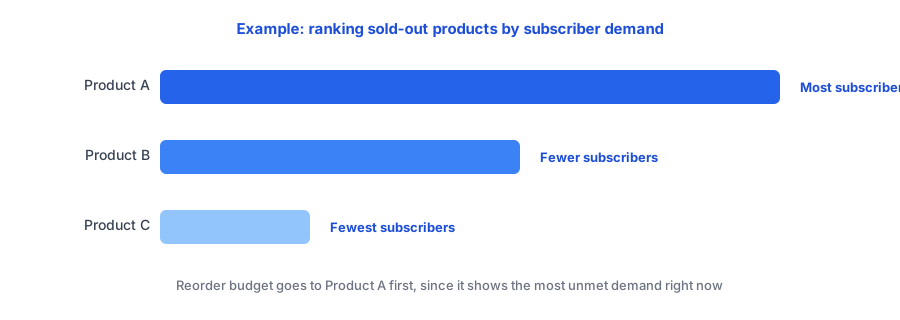
Picture three sold-out products at once: one with a long list of people waiting, one with a modest handful, and one with almost none. Sales velocity might have looked similar for all three before they ran out, but the subscriber counts tell a very different story about what to reorder now. The product with the most subscribers represents the most unmet demand sitting on the table today, and every day it stays unavailable, some of those shoppers will buy the item somewhere else or give up on it entirely.
See which of your own sold-out products have the most demand waiting.
Install Griffin on ShopifyA Simple Framework for a Limited Reorder Budget
Most merchants don't have the cash flow to restock everything that sold out at once, so subscriber counts become a prioritization tool, not just a curiosity. Deciding which products to restock first shopify gets a lot easier with a short framework:
- Rank sold-out variants by subscriber count first, not by how well they sold historically.
- Check how recently the signups came in. A product with subscribers still trickling in today carries more urgency than one where signups stalled weeks ago.
- Cross-reference against margin and lead time. A high-demand item that takes eight weeks to restock might need to be ordered before a high-demand item with a two-day turnaround, even if the second one has more subscribers.
- Watch the variant-level split before placing a bulk reorder, so you don't restock a color or size nobody is actually waiting on.
None of this replaces judgment about margin, cash flow, or supplier lead times, but it replaces guessing about demand with an actual number pulled from your own store.
FAQ
What's the difference between sales velocity and back-in-stock subscriber data?
Sales velocity measures how fast a product sold while it was in stock, and it stops updating the moment the product sells out. Back-in-stock subscriber counts measure ongoing demand after the product is gone, based on shoppers who visited the sold-out page and asked to be notified.
Can I see demand at the variant level, not just the product level?
Yes, as long as your back-in-stock app tracks subscribers per variant rather than per product. That's what shows whether a specific size or color is driving the interest, rather than the item as a whole.
Do I need a certain number of subscribers before the data is useful?
No. Even a handful of subscribers on a sold-out variant is a real signal that a sales report can't give you at all once inventory hits zero. Compare products relative to each other rather than waiting for a specific threshold.
Does this replace normal inventory forecasting?
No. It's a demand signal to layer on top of forecasting, most useful for prioritizing which sold-out items to restock first when reorder budget or supplier lead time is limited.
The Bottom Line
Sales history tells you what already happened. Back-in-stock subscriber counts tell you what's happening right now, on the exact product pages where customers are showing up and asking to be notified. Used together, they turn "restock everything eventually" into a prioritized list based on real, current interest.
If you're deciding what to reorder next, Griffin's Subscriber Analytics shows exactly which sold-out products have the most demand waiting, right alongside the Notify Me widget your customers already use. Install Griffin on the Shopify App Store to start tracking that demand on your own store, free to start.